Air pollution is a global environmental and public health concern, particularly in densely populated urban areas. It poses severe risks to human health, including respiratory diseases, cardiovascular problems, and premature mortality. The recent State of Global Air report found that air pollution caused 170k kids’ deaths in India in 2021. Understanding the spatial and temporal variations in air pollutant concentrations is crucial for formulating effective air quality management strategies and mitigating the adverse impacts on public health and the environment.
The study by Climate Trends focused on assessing the air quality levels of seven major cities in India: Delhi, Chandigarh, Lucknow, Varanasi, Patna, Kolkata, and Mumbai, to investigate the concentrations of key air pollutants, including PM2.5, PM10, NO2, SO2, CO, and Ozone, which can provide critical insights into peak air quality challenges and inform mitigation strategies. Palak Balyan, research lead, Climate Trends, says, “Over the past few years, there has been increased attention on the particulate matter in the air and how it is impacting human life. We now have a very comprehensive national-level programme to reduce PM levels. However, the source of other pollutants in the air may vary, and different interventions may be required. Hence, we need to study the other pollutants and track PM levels to ensure an overall reduction in pollution levels in the country.”
Advertisement
The selected cities represent diverse geographical locations, population densities, and industrial activities, offering insights into the different air quality dynamics across regions. As the capital city, Delhi often faces severe air pollution challenges due to various anthropogenic activities, vehicular emissions, industrial pollution, and geographical factors like stubble burning. Other cities such as Mumbai, Kolkata, and Lucknow are also known for their significant pollution levels, albeit influenced by different sources and factors.
The study seeks to build a case and play a crucial role in informing public health decisions, shaping environmental policies, identifying pollution sources, addressing environmental justice issues, understanding climate change impacts, and advancing scientific knowledge. These insights are essential for creating sustainable and healthy urban environments.
Multipollutant analysis is crucial for understanding the complexities of air pollution and its impacts on public health and the environment. Air pollution consists of a mixture of pollutants emitted from various sources, including vehicles, industries, and natural sources. Multipollutant analysis helps examine the interactions and synergistic effects among different pollutants, providing a more comprehensive picture of air quality. Moreover, multipollutant analysis helps in identifying the sources and mechanisms contributing to air pollution. Different pollutants have distinct sources and emission patterns. For instance, particulate matter (PM) may originate from combustion processes and industrial activities, while nitrogen dioxide (NO2) is often associated with vehicular emissions.
Results:
During the initial months of the year, a declining trend in pollution levels was observed across various cities in the Indo-Gangetic Plain (IGP) region of India. While PM10 and PM2.5 emerged as the predominant pollutants in all cities, NO2, ozone, SO2, and CO were mostly under safe limits, according to NAAQS. This consistent pattern suggests a common source of pollution across the region, likely stemming from industrial activities, vehicular emissions, and agricultural practices.
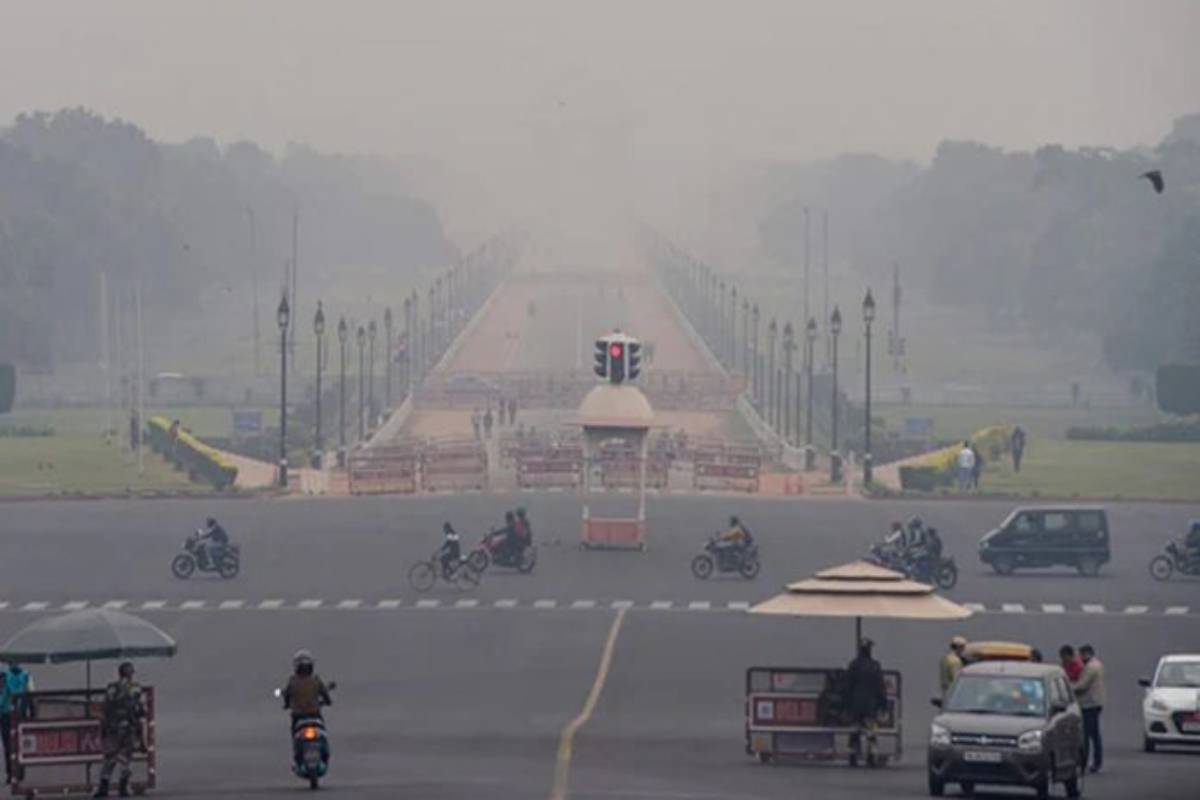
Delhi, as a major urban centre, exhibited relatively high pollution levels. With average pollution levels for PM2.5, PM10, NO2, SO2, CO, and Ozone at 155.6 µg/m³, 268.1 µg/m³, 48.70 µg/m³, 12.3 µg/m³, 1.4 µg/m³, and 24.2 µg/m³ respectively, it underscores the urgent need for stringent pollution control measures. Conversely, Varanasi displayed comparatively lower pollution levels across all parameters, with PM2.5, PM10, NO2, SO2, CO, and Ozone averaging at 23.1 µg/m³, 57.7 µg/m³, 11.8 µg/m³, 18.1 µg/m³, 0.8 µg/m³, and 13.8 µg/m³ respectively, suggesting more effective pollution management strategies or environmental initiatives in place.
Furthermore, specific factors such as ongoing construction in cities like Patna may have contributed to heightened PM10 levels, primarily emanating from dust and construction activities. This highlights the necessity for sustainable urban development practices and stricter regulations to minimise the adverse environmental impact of infrastructure projects. Overall, the data underscores the importance of continuous monitoring and proactive measures to address pollution challenges in the Indo-Gangetic Plain and ensure sustainable environmental stewardship. Vivek Panwar, assistant professor at Venkateshwara College, University of Delhi, says, “Improving air quality requires a comprehensive approach that goes beyond particulate matter, encompassing a variety of pollutants and their origins to protect public health and the environment effectively. Additionally, this approach aids in gaining a concise understanding of sources within the region.”
Some key observations based on the pollution levels for the specified cities:
PM2.5 and PM10 levels: Delhi exhibits the highest average levels of PM2.5 (155.6 µg/m³) and PM10 (268.1 µg/m³), indicating severe particulate pollution. Patna follows with PM10 levels at 285.4 µg/m³, likely influenced by ongoing metro construction activities.
NO2 concentrations: Delhi also records the highest average NO2 levels (48.70 µg/m³), reflecting significant vehicular emissions and industrial activities. Kolkata and Mumbai show moderate levels, while Varanasi displays the lowest NO2 concentration among the cities listed.
SO2 levels: Varanasi exhibits the highest average SO2 level (18.1 µg/m³), possibly due to industrial emissions or combustion processes. Chandigarh and Lucknow also show relatively elevated SO2 levels compared to other cities.
CO concentrations: CO levels are generally low across all cities, with Patna recording the highest average concentration (1.6 µg/m³), followed by Delhi and Chandigarh.
Ozone levels: Mumbai exhibits the highest average ozone concentration (30.5 µg/m³), likely influenced by industrial emissions and atmospheric processes. Kolkata follows with relatively high ozone levels, while Varanasi displays the lowest average concentration.
Regional disparities: Varanasi stands out with comparatively lower levels of PM2.5, PM10, and NO2 compared to other cities, indicating relatively better air quality in the region. On the contrary, Delhi and Patna experience significantly higher pollution levels across multiple parameters, highlighting the urgent need for pollution control measures.
Urban Development Impact: Ongoing metro construction in Patna probably contributes to heightened PM10 levels, indicating the environmental impact of infrastructure projects on air quality. These observations emphasise the critical need for targeted interventions and stringent regulatory measures to address air pollution challenges, particularly in heavily urbanised areas like Delhi and Patna, to safeguard public health and environmental well-being.
A report by Climate Trends