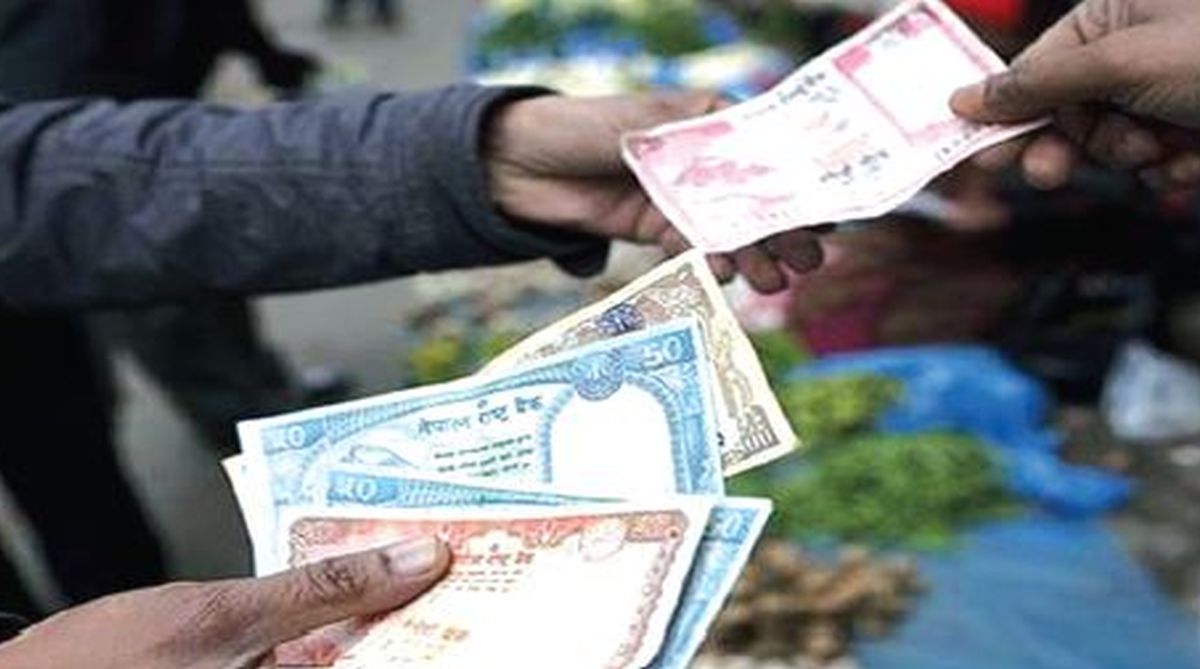
Three-fifths of Nepal’s trade deficit is accounted for by India. This dependence is the primary reason why Nepal pegs its currency – the Nepalese rupee (NPR) – to the Indian rupee (INR). Since 1993, the peg has been left unchanged at one INR to 1.60 NPR. A lot has changed in the last 25 years. This has given rise to talk of whether or not the peg reflects today’s reality or if Nepal needs a peg at all.
This issue has gained more relevance this year as the NPR has massively depreciated against the US dollar. The greenback strengthened from Rs.102.12 on December 29 last year to Rs.119 on October 11, before giving up some of the gains. The Nepali rupee was simply tracking the drop in its Indian counterpart. The Indian rupee is not the only emerging-market currency to take it on the chin this year. Other currencies such as the Indonesian rupiah, South African rand and Turkish lira fell sharply against the dollar.
Advertisement
In a pegged exchange rate, the value of one country’s currency is fixed to the value of another country’s currency. Market forces do not play a role. In contrast, most major currencies like the US dollar, euro and Japanese yen are free floating. Between 1870 and 1914, when World War I began, there was a fixed exchange rate globally, under which all currencies were linked to gold.
This was known as the gold standard. In 1944, as World War II was still raging, countries gathered in Bretton Woods, New Hampshire, and agreed to peg currencies to the US dollar, which was pegged to the price of gold at $35/ounce.
This system continued until 1971, when US President Richard Nixon cancelled the convertibility of the dollar to gold. In Nepal, the rupee was introduced in 1932. Until 1956, when Nepal Rastra Bank, the nation’s central bank, was established, both the Nepali and Indian rupees were legal tender. The dual currency system was abolished under the Nepal Currency Circulation and Expansion Act of 1957.
Pegging has its advantages and disadvantages. Broadly, stability is the often-cited reason why a country decides to peg. If a currency is too volatile, foreign investors may think twice before bringing in money. Nations that have export and trade in mind would prefer to keep the exchange rate low to boost competitiveness.
If a country with lower production costs has pegged its currency to that of a richer country with a stronger currency and if the latter moves production to the former, other things remaining the same, both benefit. The richer country also faces no currency risk – hence predictability. In the country with lower production costs, profit is enhanced as it gets translated into its currency.
The downside is that imports become expensive. It can also be expensive to maintain the peg. The Thai baht was once pegged to the US dollar. During the 1996-1997 Asian currency crisis, the government was unable to defend the peg. In July 1997, the baht was floated just ahead of an IMF bailout.
A central bank may also lose control over its monetary policy. Hong Kong pegs its currency to the US dollar. Post-financial crisis of a decade ago, the Federal Reserve drastically lowered its benchmark interest rates. Hong Kong followed suit, which helped light a fire – arguably unsustainably – under its property market.
Importantly, if a country is in an infrastructure investment phase but lacks resources, a strong currency helps. In contrast, China, which each day sets a rate for the yuan to trade in a band against the greenback, for years has been accused of artificially keeping the exchange rate low to use it as a mercantilist weapon.
Now, China increasingly is trying to move away from reliance on exports toward domestic consumption. The near-term outlook of the yuan is muddled because of ongoing trade tensions with the US, but in years to come Chinese consumers should benefit from a stronger yuan. The point in all this is that there is no ‘one size fits all’ in the currency land. The variables are constantly changing.
When the Indian rupee goes up or down in response to a change in the Reserve Bank of India’s monetary policy, this is equivalent to ‘when India sneezes, Nepal catches a cold’. So why stay shackled to this? It is easy posing that question. Generating an answer, on the other hand, is not as easy, especially when there is an open border between the two nations.
Going fully convertible is a sign that a country and its markets have reached maturity. Although immediately after, things will remain volatile. Nigeria waited until 2016 to unpeg its currency – the naira – from the US dollar. Saudi Arabia still pegs its riyal to the US dollar; its major export – oil – is priced in dollars. Right at this minute, it is tough to argue if Nepal has the proper infrastructure in place for a free float.
At the same time, one way to tell if the peg is working to Nepal’s advantage is if Indian manufacturing begins to move up north, which has not happened. Granted there are a whole host of other issues -from regulatory hurdles to lack of electricity – as to why this may not have happened, the fact remains that a low NPR can act as export subsidy for Indian manufacturers. Is the exchange rate not low enough then?
Since the pegging was last reviewed in 1993, Nepal’s reliance on India has grown. In the 1992/’93 fiscal year, India’s share in Nepal’s total trade was down to 28 per cent. In 2017/’18, this was nearly two-thirds. During the period, India’s living standards grew faster. Back then, GDP per capita in Nepal was $180. In 2017, it stood at $835. In India, they were respectively $298 and $1,940.
In the meantime, the make-up of the Nepalese economy has changed. Remittances currently account for more than one-fourth of the GDP; in 1993, this was non-existent. A weak currency helps as these funds get translated into more rupees. But then again Nepal is entering an investment phase in which the country needs to build its infrastructure. A weak currency could be costly. This is where it gets tricky.
Macro variables are not static. As the economy evolves, sectors that were given the maximum emphasis/ weight by policymakers may cease to do so as time passes. This requires constant review of the nation’s currency policy. The peg has been left unchanged for too long. Before the 1993 revaluation, the INR went from 1.60 NPR in FY1964/’65 to 1.01 in 1965/’66 to 1.35 in 1967/’68 to 1.39 in 1971/’72 to 1.45 in 1977/’78 to 1.68 in 1985/’86 to 1.65 in 1990/’91.
The Kathmandu Post/ANN.


