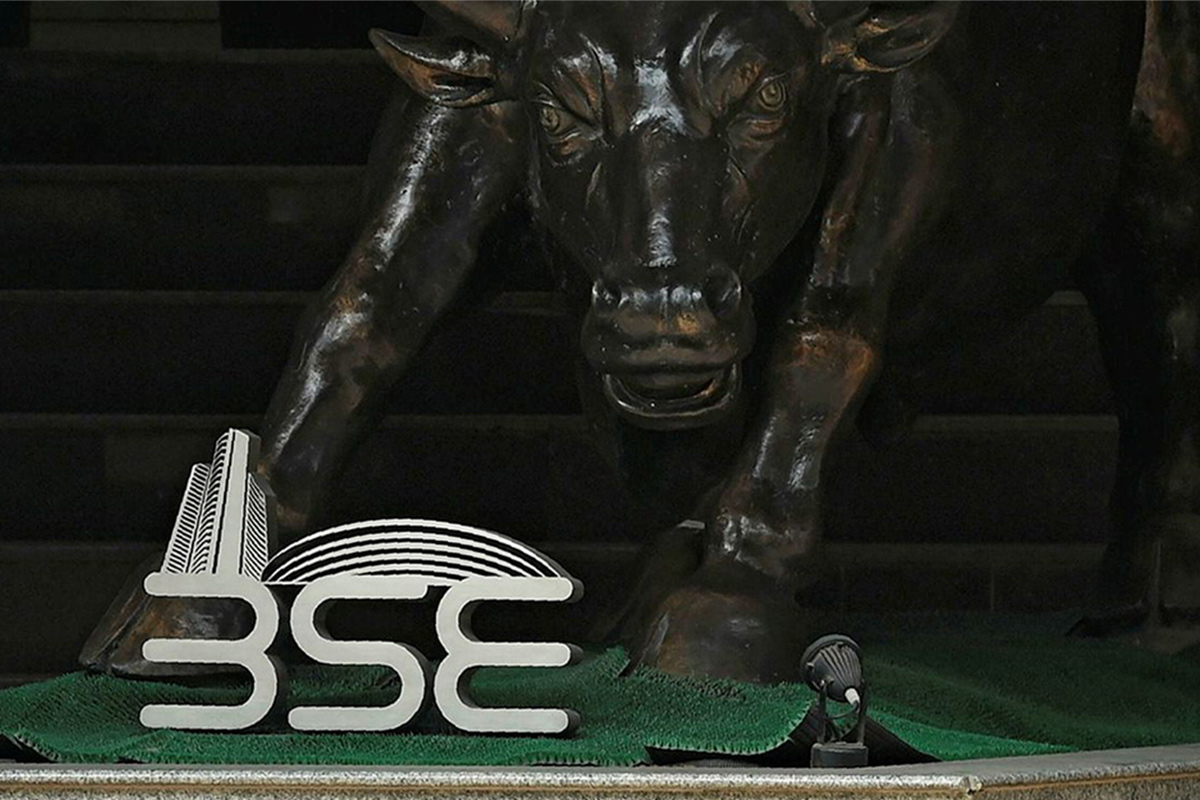
Market ends with no change in muted session
At close, Sensex was up 10.31 points or 0.01% at 74,612.43, and the Nifty was down 2.50 points or 0.01% at 22,545.05.
Global market cap rose 7.3 per cent ($7.2Tn) over the last 12 months, while India’s market cap jumped 17.2 per cent Barring Russia and China, all key global markets witnessed a rise in market cap over the last 12 months, Motilal Oswal Financial Services said in a report.

(Photo: AFP)
Global market cap rose 7.3 per cent ($7.2Tn) over the last 12 months, while India’s market cap jumped 17.2 per cent Barring Russia and China, all key global markets witnessed a rise in market cap over the last 12 months, Motilal Oswal Financial Services said in a report.
The Nifty ended higher for the fourth consecutive month in June’23. The index oscillated 737 points before closing 655 points (or 3.5 per cent ) higher MoM at 19,189 – a new peak. The Nifty is up 6 per cent in CY23YTD. Midcaps/smallcaps outperformed largecaps by 3.1 per cent /2.4 per cent in June’23. Similarly, over the last 12 months, midcaps/smallcaps have outperformed largecaps and have risen 35 per cent /28 per cent vs. a 22 per cent rise for the Nifty.
Advertisement
FII inflows are the highest since September’22. FIIs remained net buyers for the fourth straight month at $6.7bn in June’23; YTD inflows stood at $11.2bn. Conversely, DIIs – after reporting outflows in May’23 – saw muted inflows in June’23 at $0.5bn; YTD inflows stood at $10.5bn, the report said.
Advertisement
Among the key global markets, Brazil (+9 per cent ), Japan (+7 per cent ), the US (+6 per cent ), India (+4 per cent ), MSCI EM (+3 per cent ), Taiwan (+2 per cent ), and the UK (+1 per cent ) ended higher in June’23, while Korea (-0.5 per cent ), and China (-0.1 per cent ) ended lower in local currency terms.
Over the last 12 months, the MSCI India index (+17 per cent ) has outperformed the MSCI EM index (-1 per cent ). Over the last 10 years, the former has outperformed the MSCI EM index by 178 per cent, the report said.
After a roller-coaster ride of 18 months, Nifty-50 finally surpassed its all-time high and touched the 19,000 mark in June’23. The feat was not at all easy though! Nifty’s journey from 18,000 to 19,000 took 425 trading days (from October’21-June’23) vs. only 31 days when it covered the journey from 17,000 to 18,000. With healthy macros, range-bound oil prices, a robust fiscal balance sheet and moderating inflation, the outlook for the market looks optimistic, the report added.
Advertisement